Page 2 - 9-phy-2 Kinematics
P. 2
Set the apparatus according to Fig. 2.1.1. Keep
the angle of inclination small (not more than
15°). Why the angle of inclination
Ž Place the iron ball on the inclined plane at is kept small?
higher end, e.g., 200cm or 250 cm.
Hold the ball with set square such that the front
of the ball coincides with the position mark.
Release the ball gently and start the stopwatch simultaneously. Stop the
watch when the ball just hits the stopper plate at the lower end. Note
DO YOU KNOW? time taken as 't1'.
When we drive a vehicle ‘ Repeat step 5 and note the time as 't2'
down a hill we always use ’
brakes to control the Find the average time 't'.
speed of the vehicle to “
counter acceleration. t = t1 + t2
2
”
• Repeat the experiment by changing the release position of the ball in
regular intervals.
Take six readings in all.
Calculate 2S and t2.
Plot the graph between 2S (along y-axis) and t2 (along x-axis).
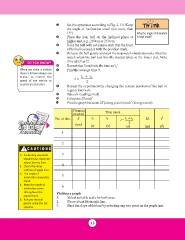
Observations Distance S Time taken 2S t2
and Data covered t1 (m) (s2)
Processing No. of obs. S (s) tt22 t = t1 + t2
2
(cm)
(s) (s)
1
! 2
1. Preferably steel ball 3
should have diameter
about 3cm to 5cm. 4
2 Clean the inner 5
surface of angle iron.
6
3. The angle of Plotting a graph
inclination should be 1. Select suitable scale for both axes.
small. 2. Draw a best fit straight line.
3. Find the slope of the line by selecting any two point on the graph line.
4. Keep the angle of
inclination same
throughout the
experiment.
5. Release the ball
gently using the set
squares.
13
the angle of inclination small (not more than
15°). Why the angle of inclination
Ž Place the iron ball on the inclined plane at is kept small?
higher end, e.g., 200cm or 250 cm.
Hold the ball with set square such that the front
of the ball coincides with the position mark.
Release the ball gently and start the stopwatch simultaneously. Stop the
watch when the ball just hits the stopper plate at the lower end. Note
DO YOU KNOW? time taken as 't1'.
When we drive a vehicle ‘ Repeat step 5 and note the time as 't2'
down a hill we always use ’
brakes to control the Find the average time 't'.
speed of the vehicle to “
counter acceleration. t = t1 + t2
2
”
• Repeat the experiment by changing the release position of the ball in
regular intervals.
Take six readings in all.
Calculate 2S and t2.
Plot the graph between 2S (along y-axis) and t2 (along x-axis).
Observations Distance S Time taken 2S t2
and Data covered t1 (m) (s2)
Processing No. of obs. S (s) tt22 t = t1 + t2
2
(cm)
(s) (s)
1
! 2
1. Preferably steel ball 3
should have diameter
about 3cm to 5cm. 4
2 Clean the inner 5
surface of angle iron.
6
3. The angle of Plotting a graph
inclination should be 1. Select suitable scale for both axes.
small. 2. Draw a best fit straight line.
3. Find the slope of the line by selecting any two point on the graph line.
4. Keep the angle of
inclination same
throughout the
experiment.
5. Release the ball
gently using the set
squares.
13